- Table 1. Summary Statistics
- Table 2. Pooled Correlation Matrix
- Table 3. Volatility of Cryptocurrencies around Chinese Ban – Univariate Analysis
- Table 4. Volatility of Cryptocurrencies around Chinese Ban – Multivariate Analysis
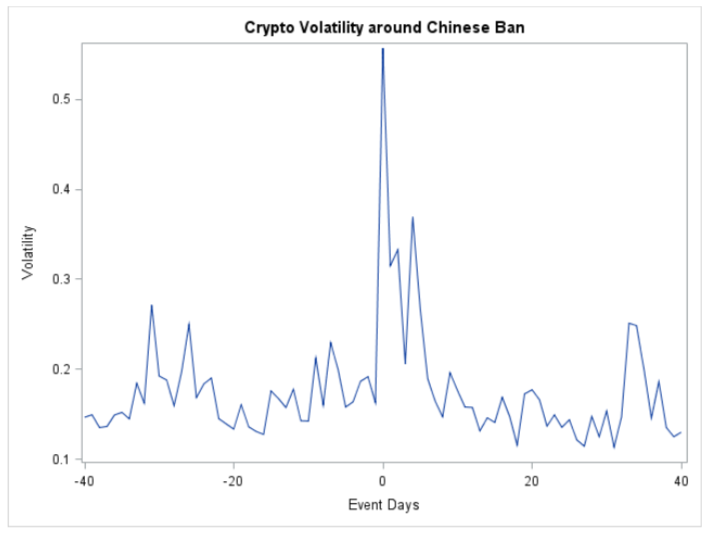
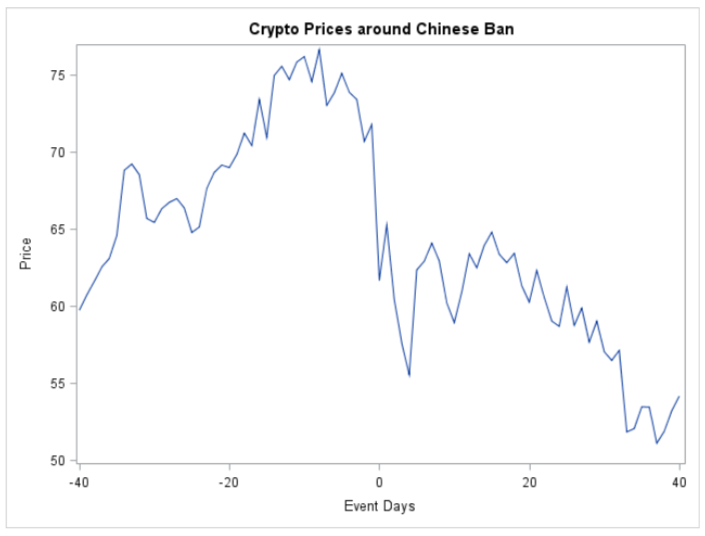
- Figure 1. Volatility and Price of Cryptocurrency Market around Chinese Ban
Table 1. Summary Statistics
This table displays summary statistics that describe the sample of 372 cryptocurrencies in the 40 days prior to May 18, 2021 when China announced it would ban cryptocurrency transactions. We obtain daily pricing and volume data from CoinMarketCap. Price is the exchange rate between the cryptocurrency and USD. Volume is the number of coins traded in USD. Rvolt is range based volatility of Alizadeh, Brandt, and Diebold (2002), or the natural log of the daily high price minus the natural log of the daily low price. Illiq is Amihud (2002) illiquidity, or absolute continuously compounded return divided by volume (scaled by 104).
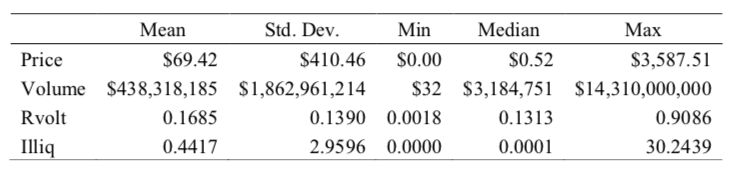
Table 2. Pooled Correlation Matrix
This table shows the Pearson pooled correlation coefficients between various cryptocurrency measures in the 40 days prior to May 18, 2021 when China announced it would ban cryptocurrency transactions. Price is the exchange rate between the cryptocurrency and USD. Volume is the number of coins traded in USD. Rvolt is range based volatility of Alizadeh, Brandt, and Diebold (2002), or the natural log of the daily high price minus the natural log of the daily low price. Illiq is Amihud (2002) illiquidity, or absolute continuously compounded return divided by volume (scaled by 104). P-values are in brackets.
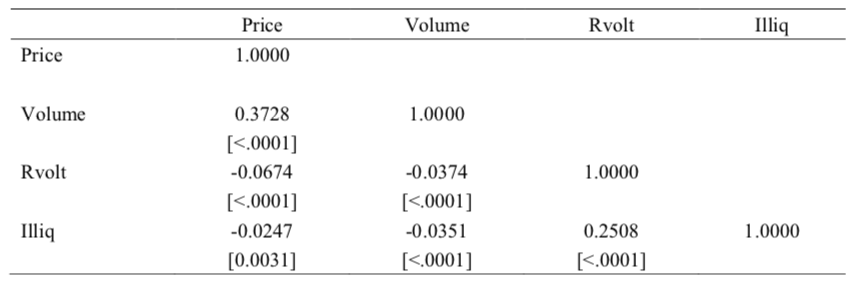
Table 3. Volatility of Cryptocurrencies around Chinese Ban – Univariate Analysis
This table displays average daily volatility for 372 cryptocurrencies in various event windows surrounding May 18, 2021 when China announced it would ban cryptocurrency transactions. Rvolt is range based volatility of Alizadeh, Brandt, and Diebold (2002), or the natural log of the daily high price minus the natural log of the daily low price. T-statistics are in parentheses and p-values are in brackets. and represent statistical significance at the 0.01 and 0.05 levels, respectively.
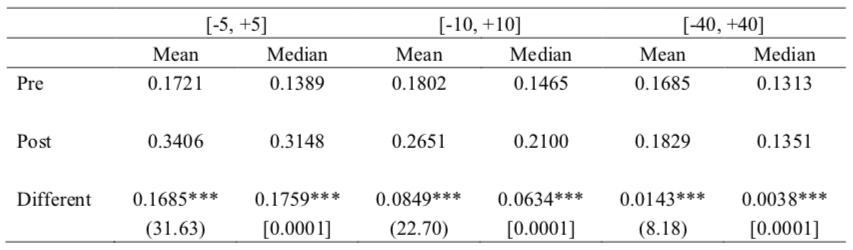
Table 4. Volatility of Cryptocurrencies around Chinese Ban – Multivariate Analysis
This table reports the results from estimating the following regression equation on a sample of cryptodaily observations:
Rvolti,t=α+1Postt+2LN(Pricei,t)+3LN(Volumei,t)+4Illiqt+i,t
where the dependent variable is range-based volatility, Rvolt, or the natural log of the daily high price minus the natural log of the daily low price. Post is an indicator variable equal to one if the crypto-day observation is on or after May 18, 2021 when China announced it would ban cryptocurrency transactions; zero otherwise. Price is the exchange rate between the cryptocurrency and USD. Volume is the number of coins traded in USD. Illiq is Amihud (2002) illiquidity, or absolute continuously compounded return divided by volume (scaled by 104). T-statistics are in parentheses obtained from robust standard errors. represents statistical significance at the 0.10 level.
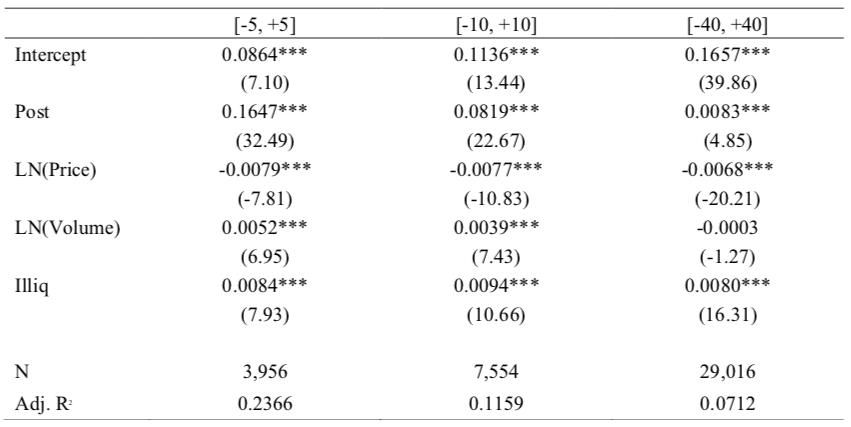
Figure 1. Volatility and Price of Cryptocurrency Market around Chinese Ban
This table plots average range-based volatility and prices across the 372 cryptocurrencies in the months surrounding May 18, 2021 when China announced it would ban cryptocurrency transactions. Rvolt is range based volatility of Alizadeh, Brandt, and Diebold (2002), or the natural log of the daily high price minus the natural log of the daily low price.